
In October 2022, the journal PNAS published an unusual experiment in which the subjects were scientists. Nate Breznau and colleagues gave 161 researchers, working in 73 teams, the same cross-country survey data and the same task: test whether more immigration reduces public support for government social policies [1]. Each team designed its own analysis. The results ranged from large negative effects to large positive ones [1].
Nobody in this study had a reason to cheat. The organizers promised every team coauthorship on the final paper whatever its results, to remove incentives that could bias the findings [1]. That is what makes the study worth reading. It shows that honest, competent people handed identical data can still disagree, and I think the right response is more analyses done in the open, rather than more suspicion.
One question, 73 answers
The data came from the International Social Survey Program, a long-running survey of political and economic attitudes, covering 31 mostly rich and some middle-income countries, plus figures on immigration from sources such as the World Bank [1]. The topic is contested, and this piece takes no side on it.
Between them, the teams produced 1,253 statistical models that ran to completion [1]. Little more than half of the estimates were not statistically different from zero, a quarter were significantly negative, and 16.9% were significantly positive [1]. Depending on which team you asked, the same data said immigration lowered support, raised it, or made no clear difference.
The written conclusions split as well. Some teams treated two different measures of immigration as separate tests, which gave 89 conclusions in total: 54 rejected the hypothesis, 23 supported it, and 12 said it could not be tested with these data [1].
A June 2024 correction reprinted the paper’s Figure 1, noting that it had appeared incorrectly [2]. The corrected figure still describes 73 teams and 1,253 models, and the notice changes nothing else [2].
Why the answers spread
The obvious suspicion is that some teams were less skilled, or steered toward what they already believed. The organizers measured both. Neither expertise nor prior attitudes toward immigration showed a statistically significant link with the teams’ numbers or their conclusions [1].
So they looked at the choices themselves. They went through every model and identified 166 distinct research design decisions, such as which survey question to use as the outcome, how to measure immigration, which data to include and which statistical estimator to use [1]. No two of the 1,261 submitted models were fully identical [1].
Then came the surprise. The identified design decisions explained only 2.6% of the total variation in results, researcher characteristics explained at most 1.2%, and 95.2% was left unexplained [1]. The authors describe decisions “so minute that they often do not even register as decisions,” which add up to very different outcomes [1].
Not every difference was a matter of taste. Some teams’ results and conclusions changed after the organizers could not reproduce them and traced the problem to coding mistakes or to code that did not match the intended model [1].
Imagine handing the same box of receipts to five careful accountants and asking whether a family saves more in winter. One counts gifts as spending and another leaves them out; one starts winter in November and another in December. Nobody is lying, yet the five reports do not agree.
That is analytic flexibility. Each choice is defensible on its own. The trouble starts when one published analysis is read as if it were the only one possible.
The same thing happens with brain scans
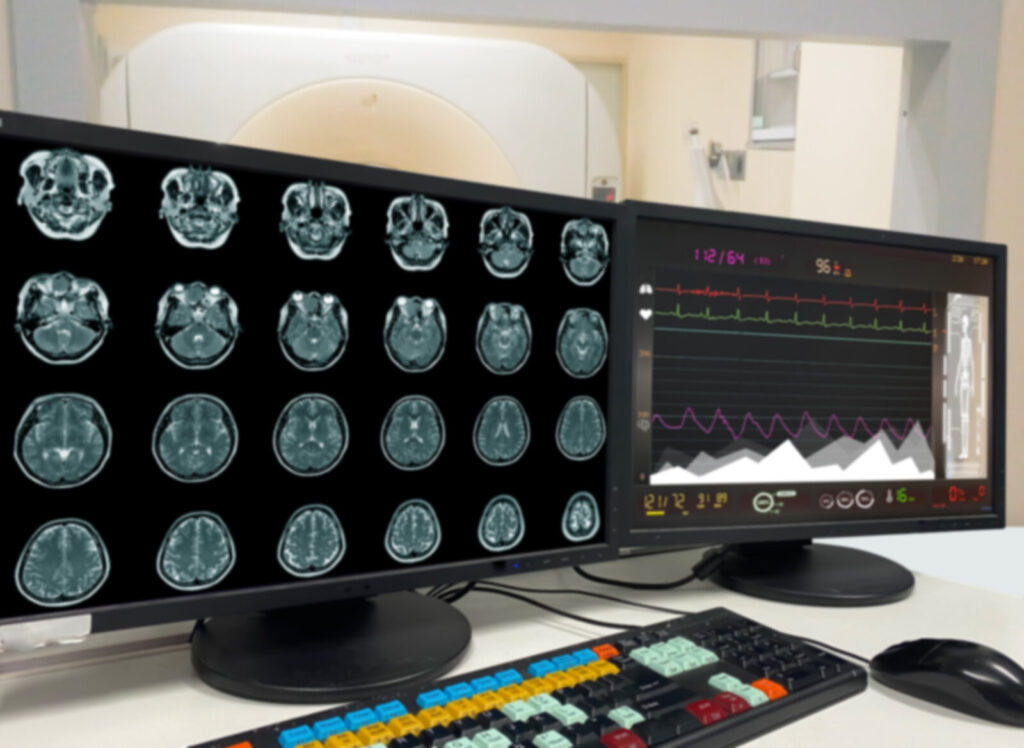
This is not only a social science problem. In 2020, Nature published a similar test in neuroimaging. Rotem Botvinik-Nezer and colleagues gave functional magnetic resonance imaging (fMRI) data from 108 people to 70 independent teams and asked them to test nine predefined hypotheses about brain activity [3]. No two teams chose identical workflows [3].
For five of the nine hypotheses, the share of teams reporting a significant result ranged from 21.4% to 37.1%, so the teams disagreed widely [3]. The strongest factor linked to a team’s answer was how smooth its statistical brain maps were, and the authors suggest it came from analysis steps other than the explicit smoothing setting [3].
There was a reassuring side too. When the organizers combined all the teams’ maps in a meta-analysis, they found significant agreement on which brain regions were active [3]. In their words, “inconsistent results at the individual team level underlie consistent results when all team’s results are combined” [3].
This one hits close to home. My research is in quantitative imaging, where I build the image processing, training and testing pipelines for deep-learning models that use breast MRI, and every such pipeline is a long chain of small settings that someone had to choose.
Flexibility is normal; hiding it is the problem
The Breznau team argues that variation between researchers “can occur even under rigid adherence to the scientific method, high ethical standards, and state-of-the-art approaches to maximizing reproducibility” [1]. I agree. Analytic flexibility is a normal feature of working with real data. The risk is treating one path through those choices as the answer.
There are good tools for making that path visible. A robustness check reruns the analysis with other reasonable choices and reports whether the answer survives. A multiverse analysis does this systematically, and the fMRI authors propose that complex datasets “should be analyzed using multiple analysis pipelines, preferably by more than one research team” [3]. They also call for public sharing of data and analysis code, so that others can rerun the analysis or validate the code [3].
Pre-registration, writing down the analysis plan before seeing the results, helps too, though its job is often misunderstood. The fMRI authors say it reduces researchers’ freedom but “would not prevent analytic variability,” while it would “ensure that the impact of variability can be assessed” [3]. The Breznau teams had submitted analysis plans before running their models, and they still diverged [1]. Pre-registration keeps an analysis honest; it does not make everyone agree.
The strongest objection is that the immigration study may overstate the problem. Its authors say they do not know how far the finding generalizes to other topics, disciplines or datasets, and that their case “might overestimate variability compared with the natural sciences” [1]. That is fair, and the brain imaging result shows that pooling many analyses can reveal a consistent signal.
What I take from it
For readers, the practical lesson is modest. When a single study makes headlines, look for whether the authors showed how their answer changed under other reasonable analyses. If it held, that is worth more than one impressive number. If it flips with every choice, the honest summary is that the data do not settle the question, which is what 12 of the 89 team conclusions in the Breznau study said [1].
Two careful analysts disagreeing about the same data is normal, and it is not a sign that someone cheated. What I want from science is to see that disagreement: more than one analysis, shared code, and plans written down before the results come in.
The authors themselves say their study did not produce evidence that moves conclusions on the immigration question in any direction [1]. What it did show is that one analysis is one path through many reasonable choices. Science becomes more trustworthy when researchers walk several of those paths and report what they find on each.
References
[1] N. Breznau, E. M. Rinke, A. Wuttke, H. H. V. Nguyen, M. Adem, J. Adriaans, et al., “Observing many researchers using the same data and hypothesis reveals a hidden universe of uncertainty,” Proceedings of the National Academy of Sciences, vol. 119, no. 44, Art. no. e2203150119, Nov. 2022, doi: 10.1073/pnas.2203150119.
[2] “Correction for Breznau et al., Observing many researchers using the same data and hypothesis reveals a hidden universe of uncertainty,” Proceedings of the National Academy of Sciences, vol. 121, no. 26, Art. no. e2410677121, Jun. 2024, doi: 10.1073/pnas.2410677121.
[3] R. Botvinik-Nezer, F. Holzmeister, C. F. Camerer, A. Dreber, J. Huber, M. Johannesson, et al., “Variability in the analysis of a single neuroimaging dataset by many teams,” Nature, vol. 582, no. 7810, pp. 84-88, Jun. 2020, doi: 10.1038/s41586-020-2314-9.
Related Articles